Unsure How Your Workforce Is Really Performing?
Managing modern teams is complex. Without clear data on workload, time usage, or task efficiency, it’s hard to optimize performance or plan for growth. Many teams rely on spreadsheets or assumptions that don’t show the full picture—leading to missed insights and uneven workloads.

A Complete Picture of Team Performance, in Real Time
Track Work Hours Seamlessly With Our Real-Time Time Tracker with URL Tracking. Whether You're Managing Individual Tasks Or Entire Projects, Our Intuitive Tool Ensures Every Second Is Accounted For.

✔
Analyze time spent across projects, departments, or individuals.
✔
Identify high and low productivity trends with visual dashboards.
✔
Understand how tasks, idle time, and engagement levels affect output.
✔
Use real-time data to balance workloads and improve team planning.
Main Features
Features That Make Workforce Analytics Insightful and Actionable
TeamTreck brings your workforce data into one place—so you can track, understand, and optimize how your teams work across time, tasks, and goals.
Advanced Productivity Reports
▲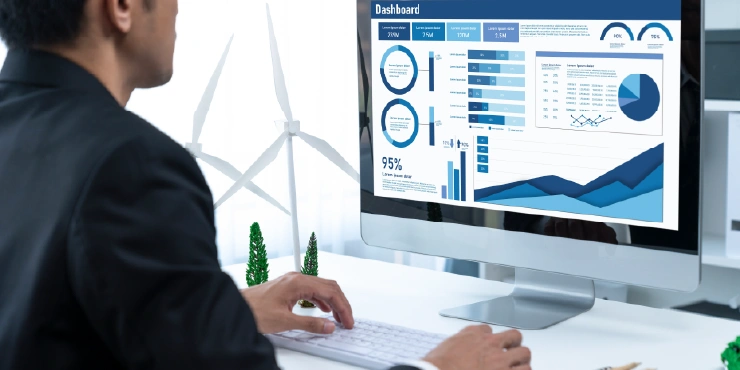
Visualize trends across individuals, teams, or timeframes. Quickly spot changes in output, effort, or engagement.
Time & Effort Tracking
▼
Track where hours go—by task, team, or project. See who’s overloaded and who’s underutilized.
Workload Overview by Team or Role
▼
Monitor capacity and allocation in real time to distribute work evenly and prevent burnout.
Exportable Dashboards & Reports
▼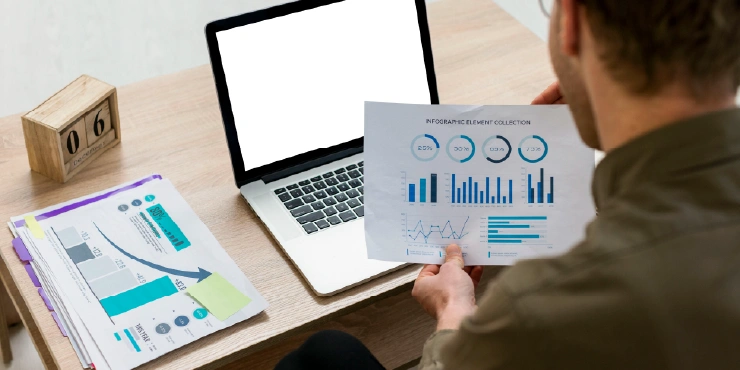
Export charts and summaries in PDF or CSV format for leadership, HR, or client updates.
What You Gain from Workforce Analytics
TeamTreck helps you lead smarter, scale confidently, and build more productive teams—by making workforce data easy to understand and act on.
Improve Team Output
See where productivity rises—or drops—and take timely action.
Balance Workloads
Avoid burnout by distributing tasks based on actual capacity and output data.
Make Data-Driven Decisions
Use insights to plan hires, assign work, or adjust timelines with confidence.
Spot Trends Early
Identify patterns that lead to delays, inefficiencies, or overwork—before they escalate.
Support Smarter Reviews
Back up evaluations, feedback, and 1:1s with real, measurable performance data.
Adapt and Scale Faster
Know what’s working, what’s not, and where to improve as your team grows.
Testimonials
What Our Users Say
"TeamTreck is a fantastic tool! It has streamlined our time-tracking process and made managing projects so much easier. The detailed reports give us clear insights into productivity, and the offline tracking feature is a big plus. Highly recommended!"
"I've used several time-tracking tools, but TeamTreck is by far the best. It's user-friendly, and the features are well thought out. Our team's productivity has improved significantly since we started using it. I love the seamless integration with our workflow!"
"TeamTreck has been a game-changer for our team. The real-time tracking and offline session management are incredibly helpful. The software is easy to navigate, and the analytics provide valuable insights. Worth every penny!"
"What I love about TeamTreck is how easy it is to use. It has helped our team stay organized and on track. The reporting tools are excellent, giving us a clear picture of how time is spent on each project. A must-have for any business!"
"TeamTreck has simplified our project management. The time-tracking feature is precise, and the analytics help us make better decisions. The best part is that it works even offline. I highly recommend it to any team looking to boost productivity!"
"Since using TeamTreck, our team has become more efficient. The interface is clean and intuitive, making it easy for everyone to adopt. We've seen a noticeable improvement in how we manage time and tasks. Great tool!"
Frequently Asked Questions
TeamTreck workforce analytics turns tracked time, activity, and usage data into dashboards that reveal how teams perform across projects and schedules.
What is employee workforce analytics?
↓
Workforce analytics measures patterns in hours worked, focus time, and productivity signals across teams. TeamTreck aggregates real-time tracking data so leaders can spot bottlenecks, compare trends, and make staffing decisions with evidence instead of assumptions.
What is workforce analytics in TeamTreck?
↓
Workforce analytics in TeamTreck gives you real-time insights into how your team spends time, how workloads are distributed, and how productive individuals and departments are.
Can I see productivity trends over time?
↓
Yes. You can track performance trends daily, weekly, or monthly across individuals, teams, or departments using visual reports and dashboards.
How is idle time calculated?
↓
Idle time is based on periods of inactivity—when there’s little or no mouse/keyboard input during tracked sessions. It helps identify bottlenecks or moments of disengagement.
Can I compare workload and output between teams?
↓
Absolutely. TeamTreck’s dashboard lets you filter data by team, role, or project to compare time usage, engagement, and productivity.
Can I export workforce reports for HR or leadership?
↓
Yes. You can export charts, dashboards, or detailed reports in PDF or CSV formats—ideal for sharing with executives or HR during reviews.
Boost Team Productivity
Start Tracking Your Time
Start Tracking Your Time
With TeamTreck
See where time goes. Boost output. Grow a stronger team.